Live View

Live View provides a sophisticated monitoring tool designed for Java developers, allowing them to observe the runtime behavior of applications in granular detail. This feature acts as a real-time diagnostic tool, presenting an immersive view into the execution of your code.
Feature Highlights
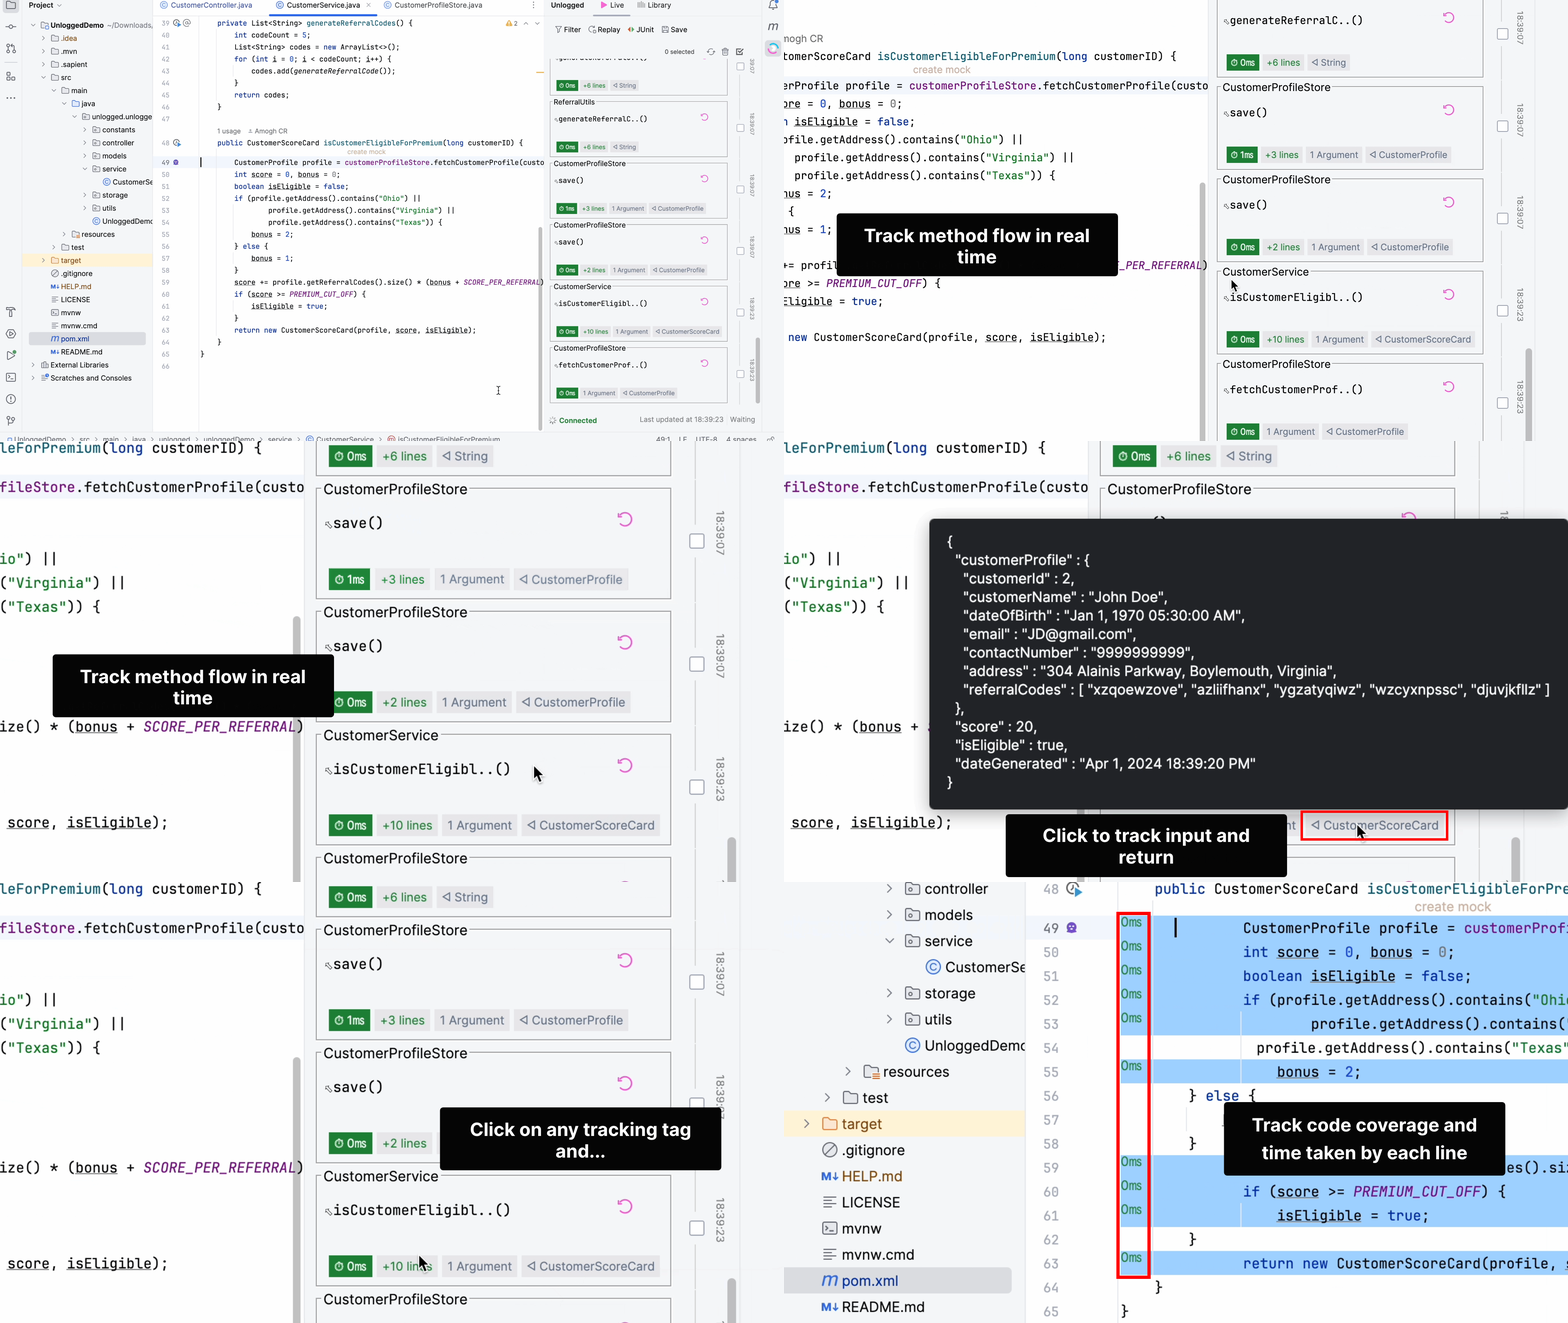
Real-Time Method Tracking: Live View offers a detailed visual representation of each method execution within your application, marked by the exact timestamp of occurrence. This feature operates entirely offline, ensuring that no code or data is transferred externally, thereby prioritizing privacy and security.
Performance Analysis: With the Performance Wizard, developers can quantify the execution time of each method, measured in milliseconds. By selecting the time icon during a replay, the tool displays the duration each line of code took to execute, offering insights into potential bottlenecks.
Efficient Debugging: hovering over any method in the Live View will reveal the input arguments and the resultant output, facilitating a quick and effective debugging process.
Code Coverage Inspection: Clicking on the executed lines within a replay illuminates precisely which lines were engaged during the method's execution, enhancing code coverage analysis.
Utilizing Replays
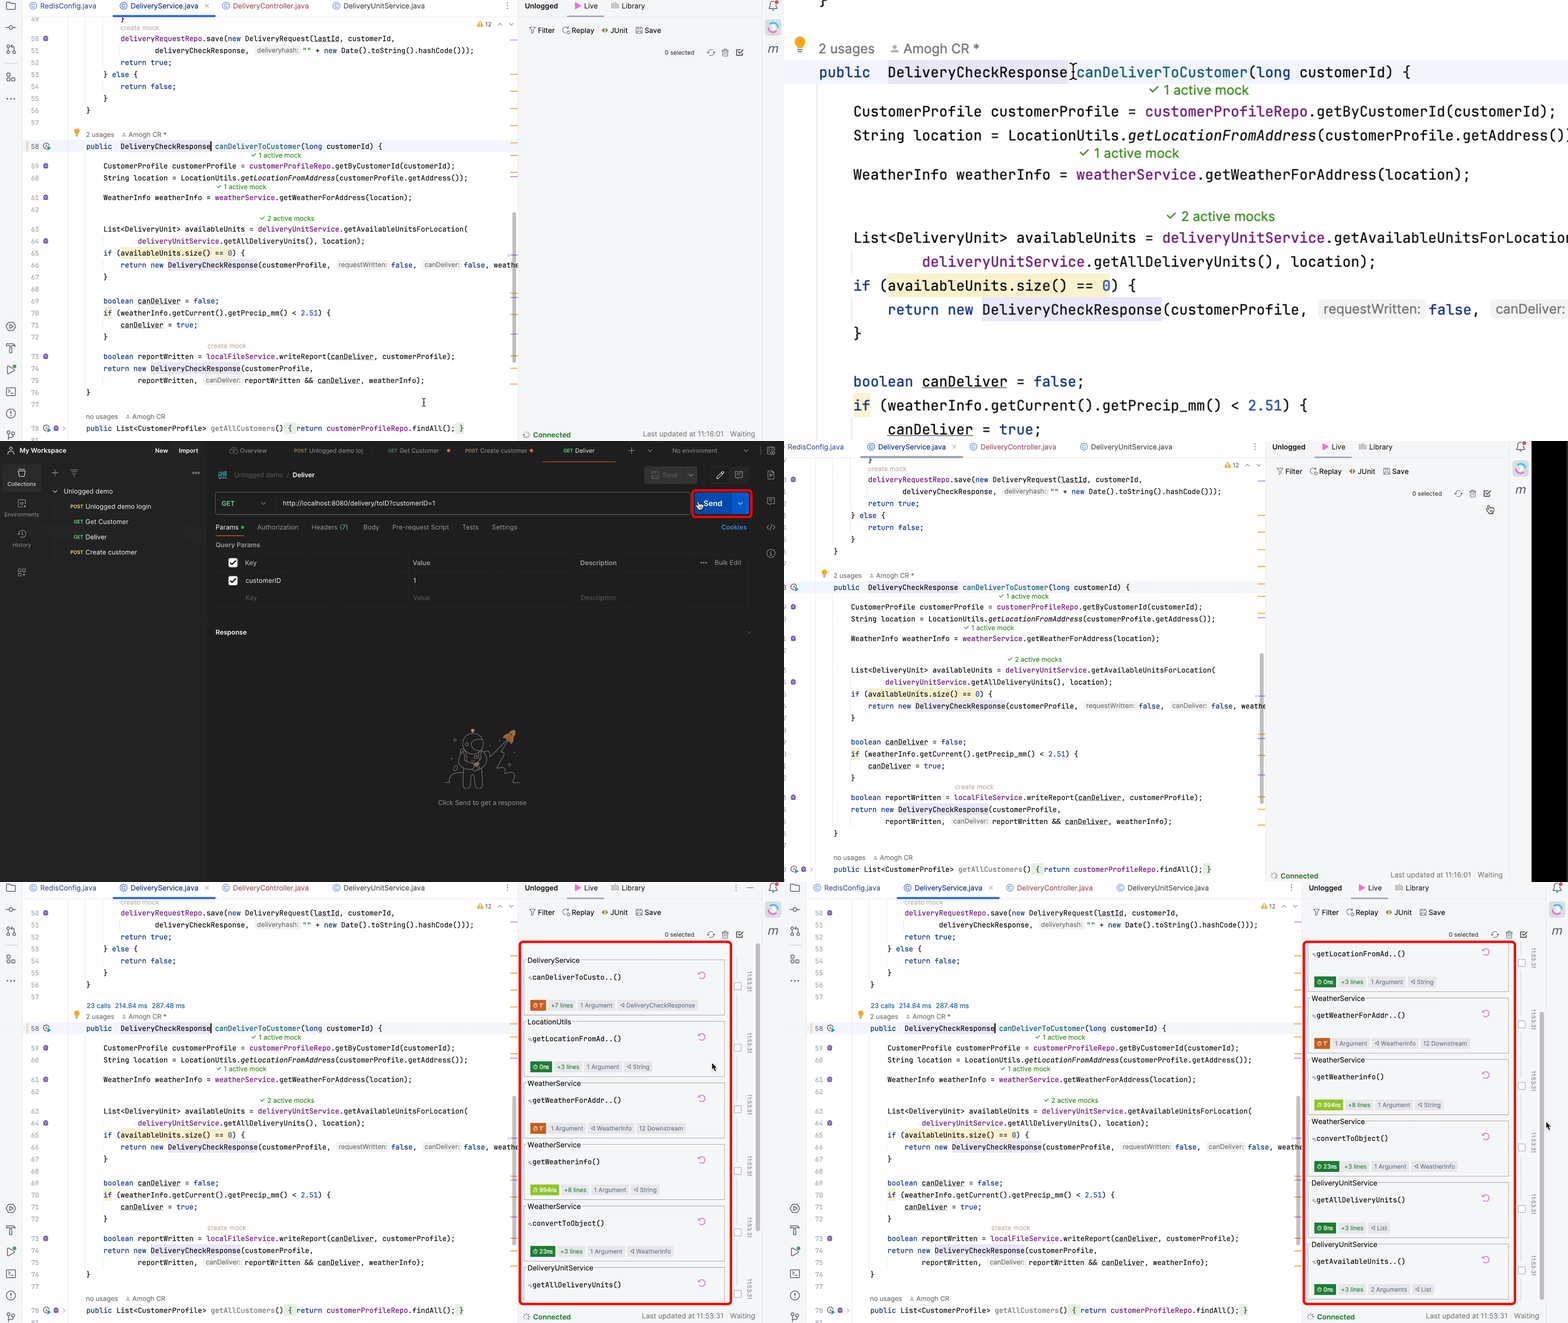
To initiate replays, developers can interact with their APIs through tools such as Postman, Swagger, or directly through the user interface. Additionally, invoking Java methods directly is supported. Replays begin populating in the Live View almost instantaneously, providing real-time feedback and analysis.
This advanced feature set is designed to empower developers by offering an in-depth look at application performance and behavior, significantly aiding in optimization and debugging efforts.
